

K-12 Schools
Landscape Analysis
We gathered data from K-12 teachers and administrators in the six Midwestern states to enable us to get the full picture of EE happening in schools throughout the region. Building on the EE provider dataset, these offer us the most extensive picture ever collected of current EE offerings in the region and what gaps and barriers exist in both formal and non-formal settings for students of all ages and in all areas.
A Landscape Analysis of
K-12 Schools,
in the U.S. Midwest
Teachers,
and Administrators
Published October 2023
Brought to you by

A collaboration between



Funded in part by


INTRODUCTION
Environmental Education is a process that helps individuals, communities and organizations learn more about the environment, and develop skills and understanding about how to address global challenges (NAAEE, 2022). Our 2021 regional Environmental Education Landscape Analysis for the Plains and Rocky Mountain region has been a resoundingly successful step towards advancing environmental literacy across six Plains and Rocky Mountain states, providing a much-needed, comprehensive look at our field. In 2023, we continued these efforts, gathering data from nearly 500 PK-12 teachers and administrators in the six Plains and Rocky Mountain states which has enabled us to get the full picture of EE happening in schools throughout the region. The two datasets together offer us the most extensive picture ever collected of current EE offerings in the region and what gaps and barriers exist in both formal and non-formal settings for students of all ages and in all areas. Comparing the data from nonformal and formal EE providers has allowed us to further our goal of advancing EE in the region and build collective impact that has a lasting effect on the Plains and Rocky Mountain region.
A Summary for Busy People
If you are short on time, here is a brief summary of our major takeaways:
PEEP's regional landscape analysis of schools was designed to provide:
-
a comprehensive look at what environmental education is (or is not) happening in schools
-
a better understanding of the needs and priorities of teachers and administrators
-
strategies for scaling programs for a broader, more equitable reach
-
state and regional findings to inform future strategic planning efforts
Our key takeaways:
-
When asked how often they take students outside, 10% of educators responded that they do this daily, and 40% do this once or twice a month to a few times a year. It is rarely done on a regular basis for any educator and is not a norm at most schools. That is a trend we would like to see change in the future.
-
When asked how likely teachers are to integrate outdoor learning into their instruction, 32% already incorporate outdoor learning into instruction; 61% indicated interest, but need support; and only 6% they are not likely to incorporate outdoor learning
-
The top barrier to incorporating outdoor learning in schools is logistics (scheduling, time, distance, staging and clean up)
-
The primary limiting factors for schools' ability to participate in field trips were transportation costs, time, availability of transportation, and site fees.
-
When asked what type of professional development educators have participated in, 21% of educators indicated they have had no professional development in outdoor education or environmental education.
-
66% of educators are teaching about climate science and of those, 50% are spending less than 10 hours per year on this topic. Most educators do not feel confident teaching this topic.
-
59% of teachers indicate that environmental education is taught in science. Only 20% see it as interdisciplinary.
-
The top terms that teachers use most, in order, are environmental education, STEM/STEAM, environmental science, conservation education, and outdoor education.
-
Educators are doing limited assessment of the impact of outdoor and environmental education in their classroom
-
Only 57% of schools have been able to make field trips accessible to all students. Diverse representation of content and speakers is limited and will be an area of growth for schools.
-
The following resources would be most helpful for increasing EE in the classroom: Teaching materials and lesson supplies, field trips, guest educators, standards-based lessons, professional development, and best practices for teaching outdoors
BACKGROUND
Our schools survey focused on five areas: integration of EE into the curriculum, professional development needs of administrators and educators, field trips, outdoor learning, and outdoor spaces. Nearly 500 schools have responded to the survey, providing us with a representative sample of schools in our region.
DASHBOARD
The dashboard is an interactive tool that educators and stakeholders can use to identify EE providers, programs, and schools in their area. The tool provides a quick snapshot of all the findings from our surveys via charts and graphs that can be filtered and exported. Educators can explore specific details through a toolbar that allows them to sort by geographic location, type of school, grade level, and numerous other filters to narrow down to their specific needs.
Clicking the image below or the button above will open the Dashboard in a new window. Please note that the dashboard is not mobile-friendly. If you are currently on a. mobile device, we encourage you to bookmark this link and return to the dashboard when you can view it on a desktop device.
FINDINGS
In 2021, PEEPs surveyed 398 teachers and 65 administrators at schools across the Midwest states to better understand access and barriers to environmental education. Of those who responded, 32% were Title I schools and 40% were located in disadvantaged communities, as defined by the Climate and Economic Justice Screening tool. The findings from that survey are summarized below.
Outdoor Learning
The following section covers our findings around outdoor learning and outdoor learning spaces at schools. An outdoor learning space is any outdoor area that is or can be used to teach outdoors at a school. These spaces could be formal outdoor classrooms, improved outdoor facilities, or simply natural spaces. Environmental education (EE) is a process that helps individuals, communities, and organizations learn more about the environment, and develop skills and understanding about how to address global challenges.
When asked how often they take students outside,
5.3% of educators responded that they do this daily, and 70.8% do this once or twice a month to a few times a year.
It is rarely done on a regular basis for any educator and is not a norm at most schools. That is a trend we would like to see change in the future.
When asked whether their school has requirements for incorporating outdoor and environmental learning:
-
33% already incorporate outdoor learning into instruction
-
66% responded that outdoor learning is not mandated


The top barriers to incorporating outdoor learning in schools are:
-
Logistics (scheduling, time, distance, staging and clean up) – 79.47%
-
Student behavior – 77.63%
-
Lack of outdoor learning supplies (clothing, books, tools) – 67.63%
-
Lack of outdoor learning spaces, amenities, or improvements – 65.53%
-
Technology/connectivity (wi-fi, electrical outlets, internet-devices) – 63.16%
-
Spaces are not accessible to all students – 58.68%
-
Maintenance of outdoor spaces – 56.31%
-
Safety (animal/plant safety concerns, street crossings, weather) – 51.84%
-
Knowing what to teach outdoors – 50%
-
Alignment to standards – 46.05%
-
Knowing how to teach outdoors – 44.05%
-
Administration support – 37.37%
-
Peer support – 33.42%
-
Parental support – 31.84%
When asked which features or resources would help to incorporate or increase outdoor learning, the following features ranked highest:
-
Available work surfaces or tables - 11.8%
-
Available seating - 11.6%
- Available shade - 10.7%
- Teaching materials - 8.6
- Available green space - 8.5%
-
Lesson Supplies - 8.2%
-
Best practices for teaching - 7.1%
-
Professional Development - 6.4%
-
Raised beds or gardens - 6.1%
-
Staffing or volunteer support - 5.9%
-
Maintenance support - 5.4%
-
Partnerships - 5.2%
-
Examples and success stories - 3.8%
Field Trips
This section is designed to share the needs and challenges schools face when taking EE-related field trips so that EE providers can better address these. Of our survey respondents, 51.6% indicated that they have taken students on environmental education-related field trips. The ideal length of time for a field trip was a full day.
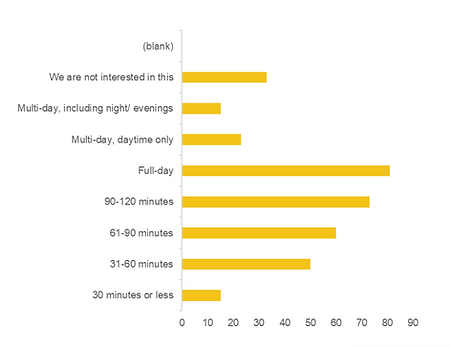
When taking your students on field trips, what is your priority?
The number one barrier to participating in field trips is the availability of transportation costs, followed by transportation costs. To increase the number of students participating in EE field trips, we need to find ways to address these barriers for schools.
The primary limiting factors for schools' ability to participate in field trips were:
-
Availability of transportation - 58.6%
-
Transportation costs - 49%
-
Site fees - 44.5%
-
Capacities of Students (Age, Behavior) - 38%
-
Time - 36.5%


Professional Development
This section focused on better understanding the professional learning interests, past experiences,and needs of educators.
When asked what type of professional development educators have participated in, 29% mentioned they received their PD from professional organization conference workshops. Research about outdoor education and EE also came in at 29% and colleague/networking interactions came in at 27%.
It is worth noting that over 30% of respondents indicated that they have had no professional development.

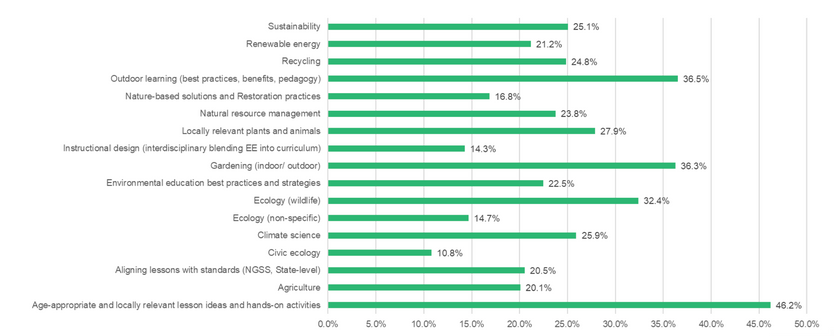
The following chart highlights the top 15 most common responses we received to the open-ended question of what environmental education professional development topics were of interest. The most common response was outdoor learning professional development on best practices, benefits, and pedagogy.
Climate Literacy
According to our survey, 59.4% of educators are teaching about climate science, and of those, 50% are spending less than 10 hours per year on this topic. NAAEE’s 2022 State of Climate Change Education Report found that only 58% feel confident talking about this topic - with only 21% feeling that they are very informed about this. Elementary teachers feel the least confident at 47%.
According to NAAEE, the top 3 reasons why teachers are not teaching about climate literacy was because:
-
Teachers aren’t confident in their ability to teach climate change.
-
Teachers don’t have enough high-quality, relevant resources.
-
Teachers don’t always feel supported by their administrators or the community.
EdWeek Research Center’s 2022 survey also found that about three-quarters of teachers say they have never received any professional training or education on climate change or how to teach it.
Integration of Environmental Education
This graphic highlights the terms most often used by schools and EE providers. This might help to determine the best way to communicate with your audiences when referring to environmental education. These terms change slightly depending on the age of the audience being served. For example, “nature-based learning” is more commonly used with early childhood audiences. Use the dashboard to filter by audience for a more refined list.

Overall, the most popular course to teach environmental education was in science. The other popular options included teaching environmental education during special events (e.g., field trips, Earth Day celebrations) and integrating environmental education interdisciplinary. There is a significant opportunity to demonstrate how environmental education is interdisciplinary and can be used as a context for teaching any subject area.
The following are the most prevalent barriers educators experience when integrating environmental education into their curriculum. Overall, the most common barriers included scheduling/ time and the availability of environmental education equipment or materials. By identifying the barriers experienced by educators, we can consider how best to remove those barriers.
-
Scheduling/Time
-
Availability of EE equipment or materials
-
Availability of curricula
-
Connecting to community partners
-
Teacher buy-in
-
Alignment to curriculum or standards
-
Pedagogical expertise


Integration
Do you include any of the following specific instructional strategies to make environmental education more inclusive for diverse audiences?
We found that only 51% of schools have been able to make field trips accessible to all students. Diverse representation of content and speakers is limited and will be an area of growth for schools.


What tools would be most valuable for increasing environmental education opportunities in the classroom?
Top Findings:
-
Field trips
-
Guest educators
-
Best practices for teaching outdoors
-
Teaching materials and lesson supplies
-
Funding strategies
-
Professional development
RESEARCH
Data collected in the original and new landscape analysis is constantly being mined for trends, guidance, and information on how to better support and build the field of environmental education. Take a look at the latest research and analysis from Erin Waddell.
Interested in doing your own research? Contact ldowney@kacee.org.
