

EE Providers
Landscape Analysis
For many years, the environmental education field has focused on providing high-caliber programs to address the lack of environmental literacy being seen in our society. It is past time to turn our attention to scale, reach, and equity.



INTRODUCTION
There are numerous organizations providing high-quality environmental education (EE) programs across the Plains and Rocky Mountain EE Partnership Regions. Environmental Education is a process that helps individuals, communities and organizations learn more about the environment, and develop skills and understanding about how to address global challenges (NAAEE, 2022).
The Plains and Rocky Mountain Regions face issues that are common across the country. Most programs operate independently of one another and, historically, little has been done to harness the collective impact of these programs to create large-scale change in each state or throughout the region. Funding often goes toward local, disjointed initiatives rather than larger-scale, capacity-building initiatives. This makes it challenging to sustain these projects in the long term or to extend the impact beyond the local community.
This analysis was designed to take a comprehensive look at the environmental education already happening on the ground, identify gaps and barriers to access that prevent successful implementation, and provide recommendations and next steps for increasing environmental literacy efforts in the Plains and Rocky Mountain Regions. This analysis will equip the organizations conducting environmental and conservation-related work in the region with the resources they need to address gaps, allocate resources more effectively, and ultimately meet the goal of increasing environmental literacy levels and stewardship behaviors.
In addition, the analysis will serve as a guide for future strategic planning efforts in individual states, as well as a regional collaborative. As a tool, it will help ensure that in the future we continue to focus our limited time and resources in areas where we will have the biggest impact.
A Summary for Busy People
If you are short on time, here is a brief summary of our major takeaways:
PEEP's regional landscape analysis was designed to provide:
-
a comprehensive look at organizational reach and program offerings
-
a better understanding of the staffing, structure, and funding of organizations and how that affects reach and sustainability
-
organizational strategies for scaling programs for broader, equitable reach
-
state-level initiatives for scaling programs for broader, equitable reach
-
state and regional findings to inform future strategic planning efforts
Our key takeaways:
-
Over 300 EE providers participated across six states (53% nonprofits, 38% government entities, 6% educational institutions, and 3% businesses)
-
Almost 25% of these entities are working with a budget less than $250,000 and an average staff size of 4 individuals
-
These providers collectively serve 930,811 students/youth and 16,355 schools annually
-
There are 76,484 volunteers across all programs
-
There needs to be more in-depth engagement opportunities for both educators and students; most programs are between 1 to 3 hours in length, and almost 40% of EE experiences are one day or less
-
Staff and leadership of EE providers do not reflect the overall demographics of the state
-
The median starting salary for environmental educators is up to 30% below the MIT living wage
-
There is a need to increase opportunities for engagement at the early childhood and high school level in order for students to receive the same level of engagement in environmental education from kindergarten through 12th grade
-
There is a need for more support and training around the importance of evaluating programs and better tools to help providers do this in a meaningful way that allows them to strengthen their programs
-
There are gaps in services found across the region in rural areas, areas with the highest social vulnerability index, and areas with the lowest income
-
There is a need for additional support and training around the importance of collecting demographic information and how it can be used to strengthen programs and opportunities for broader engagement.
BACKGROUND
The main driver of this project was to gain an enhanced understanding of the environmental education providers in the Plains and Rocky Mountain Regions who are working towards the same or similar goals. Through the design and implementation of an environmental education program provider survey tool, we engaged in a robust mapping process to gather and share the insights and offerings of more than 300 EE providers across the Plains and Rocky Mountain Regions. The survey was designed not only to determine who the players were but also to provide a baseline dataset of the current assets and barriers in our field so that we would be equipped to take a more holistic approach to advancing environmental literacy efforts in the regions.
DASHBOARD
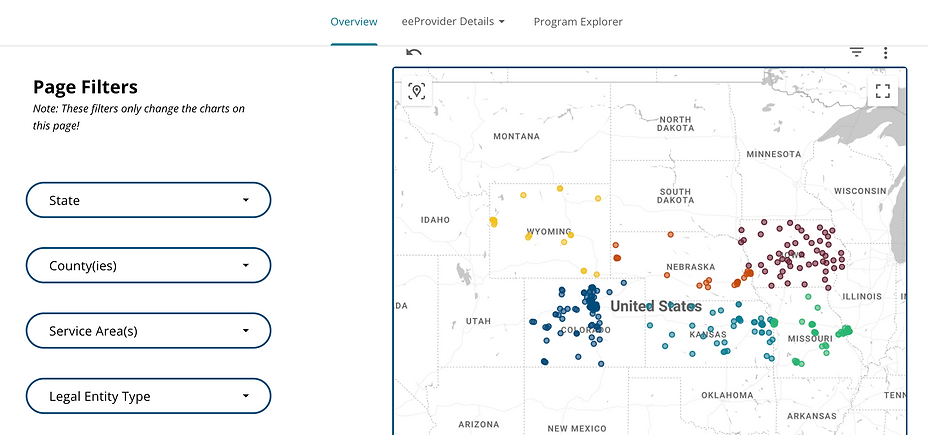
The dashboard is an interactive tool that educators and stakeholders can use to identify EE providers, programs, and schools in their area. The tool provides a quick snapshot of all the findings from our surveys via charts and graphs that can be filtered and exported. Educators can explore specific details through a toolbar that allows them to sort by geographic location, school, organization, and numerous other filters to narrow down to their specific needs. Educators and stakeholders can also access a complete list of EE providers and program profiles for the providers who completed
the survey.
Clicking the image below or the button above will open the Dashboard in a new window. Please note that the dashboard is not mobile-friendly. If you are currently on a. mobile device, we encourage you to bookmark this link and return to the dashboard when you can view it on a desktop device.
MAP
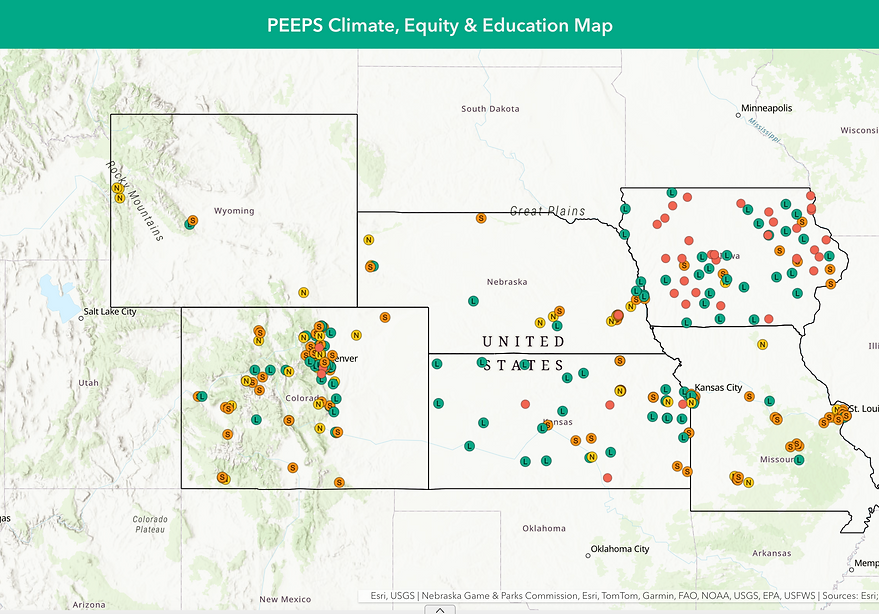
We found geographic gaps in most states where no environmental education providers are located. These tend to fall in rural areas, areas with the highest social vulnerability index, and areas with the lowest income.
The number of EE programs in each state ranges from 16 (3%; Wyoming) to 307 (58%; Colorado), with an average of 89 programs per state.
Because our data only shows us the headquarters of the providers, we cannot be certain that these areas are underserved, but given that most of the environmental education takes place as field trips or direct teaching, we can make an assumption that many of these areas go unsupported due to the distance it would take to serve them.
FINDINGS
Our survey included responses from over 300 EE providers (53% nonprofits, 38% government entities, 6% educational institutions, and 3% businesses). Almost 25% of these are working with a budget of under $250,000 and an average staff size of 4 individuals. To conduct a more in-depth review and analysis of the data, PEEPs contracted 2nd Nature Trec, an organization that provides a wide range of services related to the outdoor industry. A summary of those findings is provided below.
Mapping
We found geographic gaps in most states where no environmental education providers are located. These tend to fall in rural areas, areas with the highest social vulnerability index, and areas with the lowest income.
The number of EE programs in each state ranges from 16 (3%; Wyoming) to 307 (58%; Colorado), with an average of 89 programs per state.
Because our data only shows us the headquarters of the providers, we cannot be certain that these areas are underserved, but given that most of the environmental education takes place as field trips or direct teaching, we can make an assumption that many of these areas go unsupported due to the distance it would take to serve them.
Field Trends Dashboard
The dashboard has a wealth of information available for educators and stakeholders. The following serves to highlight some of the regional findings, with the understanding that the data can be sorted by any number of and combination of factors such as state, sector, themes, audience served, and so on. For more details on how to use this tool to dig deeper into the data, please see the dashboard tutorial.
Program Themes
With the data showing strong alignment across all six states, the predominant program themes in the region emerged as: Conservation, Outdoor Learning, Water, and STEM. Themes around Transportation, Green Building, and Marine & Coastal reported the fewest programs.
The top terms that teachers use most often include:
-
Environmental Education
-
STEM/STEAM
-
Environmental Science
-
Conservation Education
-
Outdoor Education
The top terms that EE Providers
use most often include:
-
Environmental Education
-
Outdoor Education
-
Conservation Education
-
Nature-Based Learning
-
STEM/STEAM
Program Offerings
The primary offerings being provided across the region were direct teaching and field trips. The primary audience served across the region tends to be 5th grade students, followed closely by 4th & 3rd grade students. Students in 9th & 10th grade receive the least program offerings. This demonstrates the need to increase opportunities for engagement at the early childhood and high school levels in order for students to receive the same level of engagement in environmental education throughout K-12th grade.
Depth of Engagement
We learned that most programs were under an hour in length, and less than half of EE experiences are more than one day. This short-term engagement matters because a key facet of effective environmental education is intensive, long-term engagement. Environmental education that is correlated with standards and provides repeated, long term engagement throughout the school year can be invaluable in enhancing learning for all students. Studies show that an intensive intervention, such as a one-week EE program, has helped upper elementary to middle school students to exhibit significantly higher pro-environmental behaviors (Larson, et al, 2010). Professional learning data mirrors this as well for teachers. These longer-term interactions inspire changes in attitudes and behavior and are shown to be much more effective than shorter, one-and-done type engagements such as a single classroom lesson.

Anecdotally, many in our field offer these shorter programs in part due to external emphasis from funders or leadership on reaching higher numbers for programs. In order to move the needle on environmental literacy and pro-environmental behavior, there is a need to shift this focus from quantity to quality.
Evaluation
Our initial review shows that almost half of environmental education providers conduct little to no formal evaluation of their programs. There is a need for more support and training around the importance of program evaluation, as well as tools that can help providers do this in a meaningful way that will help them strengthen their programs. Our eeGuidance on Evaluation is designed to demystify the evaluation process and address these barriers. Coming soon!
Demographics
If we adjust for non-responses, our data shows us that 7% of environmental education staff identify as Black, Indigenous, or Persons of Color (BIPOC), which is significantly lower than the plains regional average of 21.5% per 2020 US Census Data. We found senior staff to be just 6.5% (2nd Nature TREC, 2022). This has identified a need for more BIPOC staff and leadership in environmental education organizations. Data showed that 26% of environmental education organizations had boards that reflected the same or higher BIPOC representation than the region.
In addition, the reported average of students served who identify as BIPOC was 45%, and educators served who identify as BIPOC was 60%, significantly higher than the regional average (28.97%) (2nd Nature TREC, 2022). However, our findings show that very few providers collect demographic data on the audiences they serve. This skews the data significantly for those organizations who are reporting demographic data, making it challenging to determine who is and is not being served. This also prevents us from being able to address demographic gaps in our region. We anticipate that the actual percentages of BIPOC being able to address demographic gaps in our region. We anticipate that the actual percentages of BIPOC students and educators served are much lower than our data suggests. There is a need for additional support and training around the importance of collecting demographic information and how it can be used to address equity and strengthen programs and opportunities for broader engagement. See SEEA's eeGuidance for Collecting Demographic Information.

Equitable Pay and Benefits
In a comparison of starting salaries for similar fields, environmental education was found to be lower than all three comparison fields. The median starting salary for environmental education reported in our survey was $38,025 for a full-time position compared to $34,900 for education, $39,100 for forestry, and $37,800 for hospitality and tourism.
This finding made the case for a reimagining of more equitable hiring and pay practices. SEEA’s’ eeGuidance for Equitable Pay and Hiring provides recommendations and highlights some best practices for environmental and outdoor education organizations. Once applied, these standards and resources will help improve employee retention, attract more diverse talent, create a sustainable career path, and establish our field as a viable profession.

Data collected in the original and new landscape analysis is constantly being mined for trends, guidance, and information on how to better support and build the field of environmental education. Interested in doing your own research? Contact ldowney@kacee.org.